Who should read this article: Administrators, Supervisors
Monitor the trend of interactions waiting in queue across selected queues and channels during a shift.
Introduction
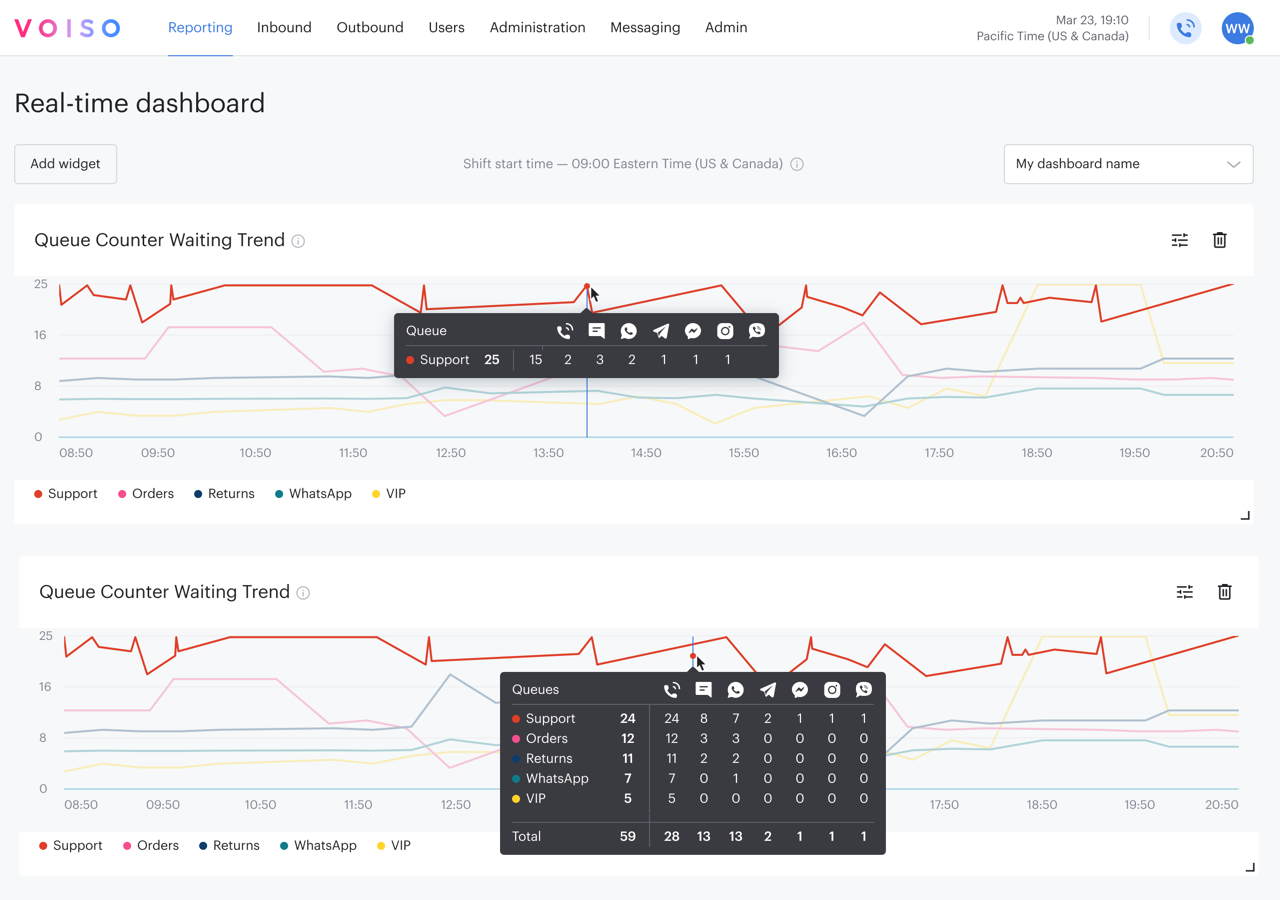
The Queue Counter Waiting Trend widget displays a line chart showing the number of interactions waiting in queue over time, broken down by queue and channel. This view helps supervisors monitor queue buildup, identify performance issues, and assess whether staffing adjustments may be needed during a shift.
A red horizontal line represents the configured Max number of calls and interactions, allowing you to quickly see when the number of waiting interactions exceeds your acceptable threshold.
Reading the plot
- To view the count at any point in time for a single queue, hover your mouse pointer over a line to read the tooltip.
- To view the count at any point in time for all queues, hover your mouse pointer over the white space between lines at the time of interest.
Setup
General tab
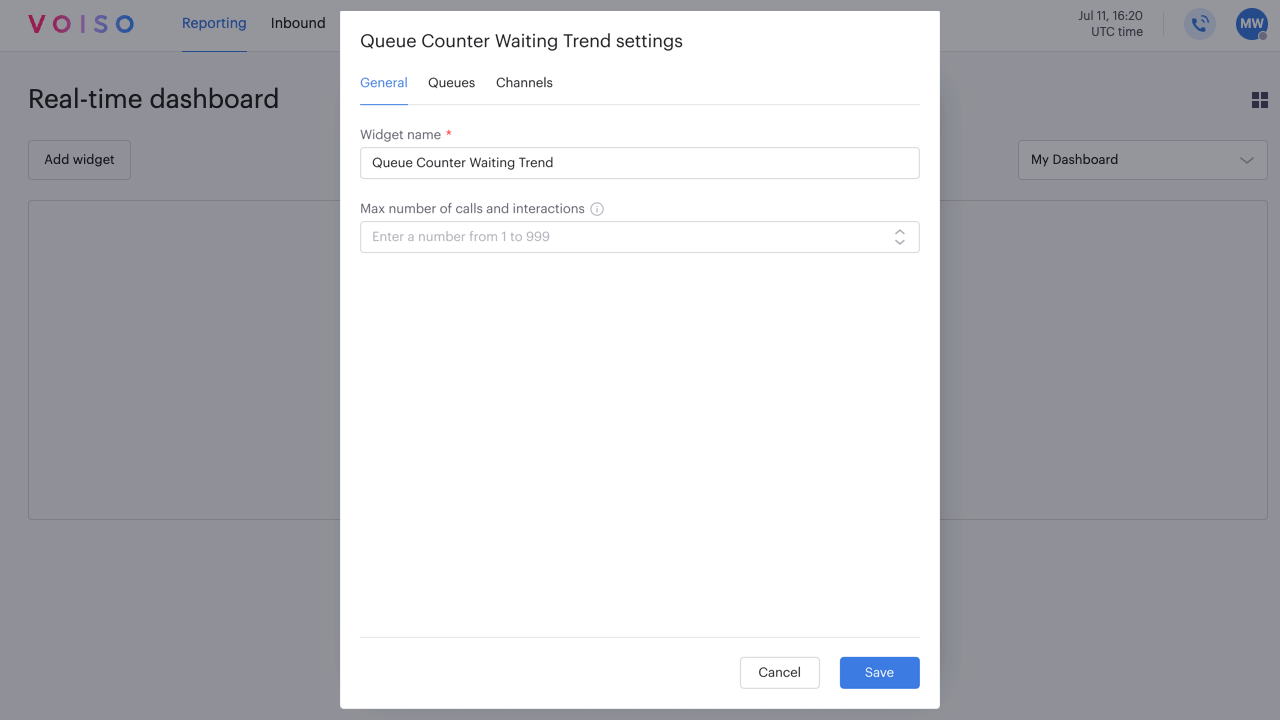
In the Queue Counter Waiting Trend settings panel, General tab, specify a name for the widget, or keep the default.
To display a red threshold line on the chart, set a value for Max number of calls and interactions. This number defines the maximum acceptable number of waiting interactions in the selected queues. Any point on the chart that exceeds this threshold will visually stand out, helping you take timely action.
Queues tab
In the Queue Counter Waiting Trend settings panel, Queues tab, select one or more queues to include in the widget.
Channels tab
In the Queue Counter Waiting Trend settings panel, Channels tab, select one or more channels to include in the widget.