Who should read this article: Administrators, Supervisors
Voiso features dashboards that administrators, managers, and supervisors can use to monitor contact center performance, agent performance, and outbound campaign performance.
Introduction
The Voiso Real-time dashboards and widgets bring clarity and organization to the day-to-day operations of your contact center. Dashboards enable you to be aware of changes before they become critical.
In the Real-time dashboard page, you can add new dashboards, then add and configure widgets that display metrics in the form of charts and tables.
Reposition widgets by dragging them around the dashboard.
The Real-time dashboards are divided into groups. Each dashboard group includes widgets for monitoring different performance indicators. You can mix and match widgets on a single dashboard or create multiple thematic dashboards.
Agent Monitoring
| Widget | Description |
|---|---|
| Agent List | Monitor agents in real-time by selected state and metrics and access Agent Zoom to view historical metrics, manage queue assignments, and initiate call monitoring features. |
| Agent Counter | Display the number of agents by status in a pie chart view, including the total number of logged-in agents. |
| Talk Time / Unique Clients | Display a comparative bar graph showing the time agents talked to unique contacts. |
| Agent Activity Duration | Display the total time that agents spent in each status. |
| Redial Counter | Show the number of call attempts to a destination number during the reporting period. |
| Service Level | Display the Time to first response, Time to reply, and Time to resolution statistics. |
| Wrap-Up Codes | Display the wrap-up codes associated with calls your team has placed. |
| Keyword Counter | Display the number of times specific keywords occurred in conversations. |
Supervisors can use the Agent Monitoring dashboard widgets to track agent availability, performance, and keyword usage.
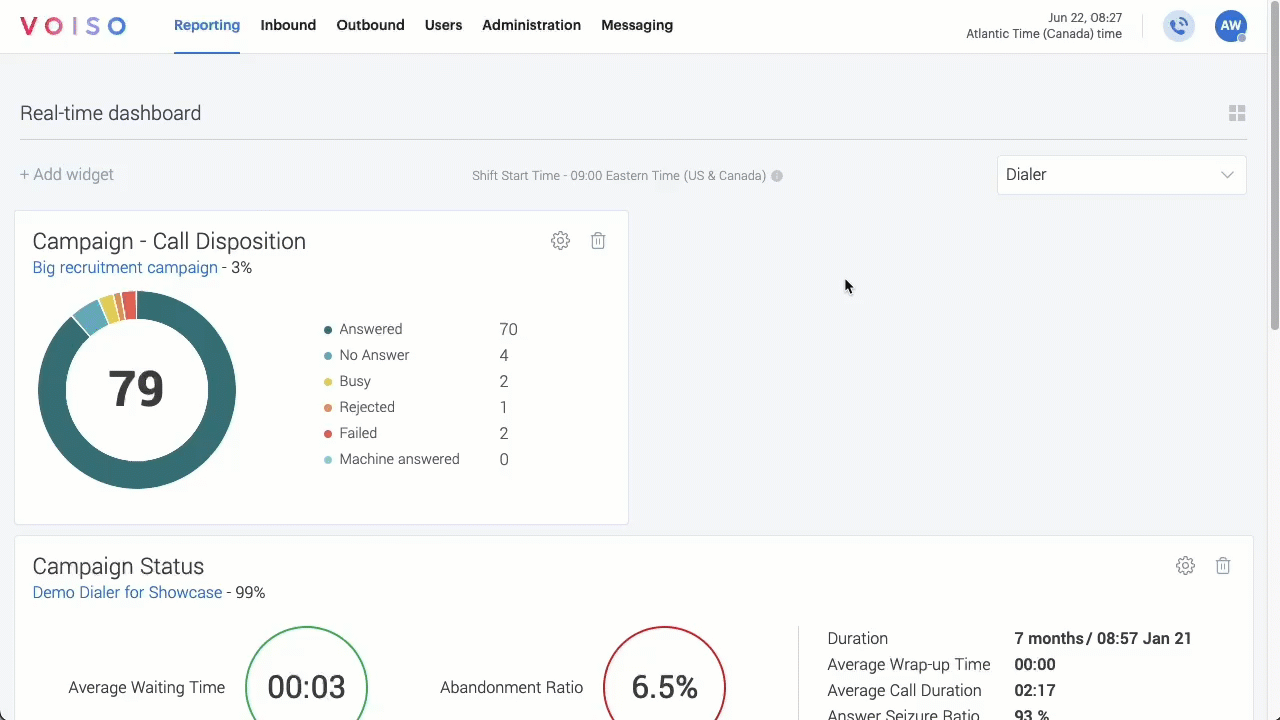
Dialer Monitoring
| Widget | Description |
|---|---|
| Campaign Status | Display metrics such as the average time it takes for an agent to answer a call and the average call length. |
| Campaign - Call Disposition | Display the number of campaign calls by the call result: answered, no answer, busy, rejected, or failed. |
| Campaign - Agent Counter | Display the number of agents who have joined the campaign and their status. |
| Campaign - Wrap-up Codes | Display the number of campaign calls by wrap-up code. |
| Campaign - Dial Attempts | Display the number of times that each campaign contact was called. |
Administrators, managers, and supervisors can use the Dialer monitoring dashboard widgets to monitor the progress and performance of outbound Dialer campaigns.
Queue Monitoring
| Widget | Description |
|---|---|
| Queue Counter by Channel | Show the number of calls in each queue for each channel to assist with rebalancing agents. |
| In-queue Abandons | Display the percentage and ratio of inbound calls dropped after the call reached a queue. |
| Average Speed of Answer | Display the average time it takes for a call to be answered by an agent. |
| Average Call Duration by Queue | Show the average length of calls by queue. |
| Agent Counter by Queue | Show the number of agents assigned to each queue. |
| Queue Counter Waiting Trend | Monitor the trend of interactions waiting in queue across selected queues and channels during a shift. |
Administrators, managers, and supervisors can use the Queue monitoring dashboard widgets to monitor activity on your queues to troubleshoot issues and ensure proper agent balancing.
Calling Number Monitoring
| Widget | Description |
|---|---|
| ASR By Caller ID By Country | Show the percentage of successfully connected calls to the total number of attempted calls by country. |
Administrators and supervisors can monitor for issues with Caller IDs in real-time.