Who should read this article: Administrators, Supervisors
Monitor the average time it takes for calls to be answered by agents assigned to each queue.
Introduction
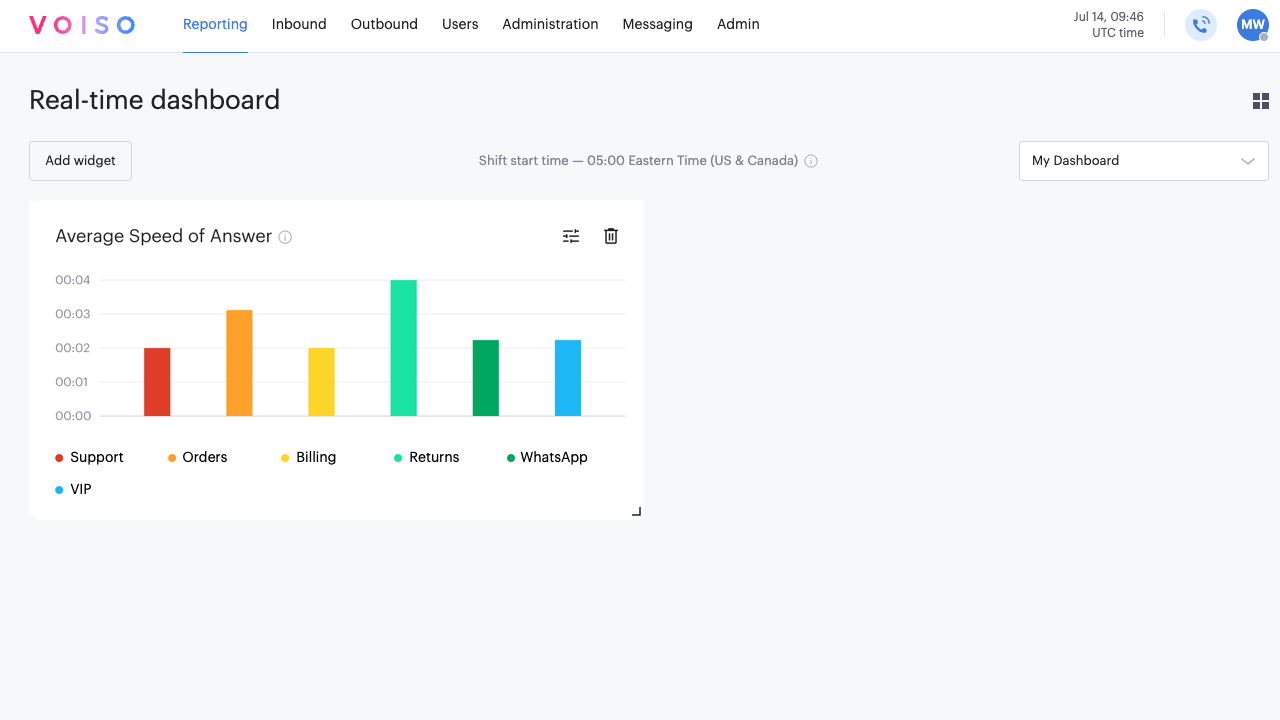
The Average Speed of Answer widget displays the average time it takes for agents to answer inbound calls after they enter a queue. This is a key performance indicator for evaluating queue efficiency and overall contact center accessibility.
The average is calculated from the moment the caller enters the Queue until the call is answered by an agent. Time spent in the IVR is not included in this calculation.
The widget presents a bar graph showing the average answer time for each selected queue over the past 15 minutes, in minutes and seconds. Each queue is represented by a distinct colored bar. Hover your pointer over a bar to view its precise average.
A threshold line, defined by the Max wait time threshold parameter, appears on the graph to help identify queues with longer-than-expected answer times.
Setup
General tab
On the Average Speed of Answer settings panel, General tab, specify a name for the widget to make it easy to know what you are monitoring. Use the Max wait time threshold parameter, in minutes and seconds, to specify a threshold line on the graph or chart.
Queues tab
On the Average Speed of Answer settings panel, Queues tab, select one or more queues to be displayed in the widget.