Who should read this article: Administrators, Supervisors
Stay on top of contact center operations with real-time visibility into agent activity, queue performance, campaign status, and more—so you can make informed decisions and act quickly.
Introduction
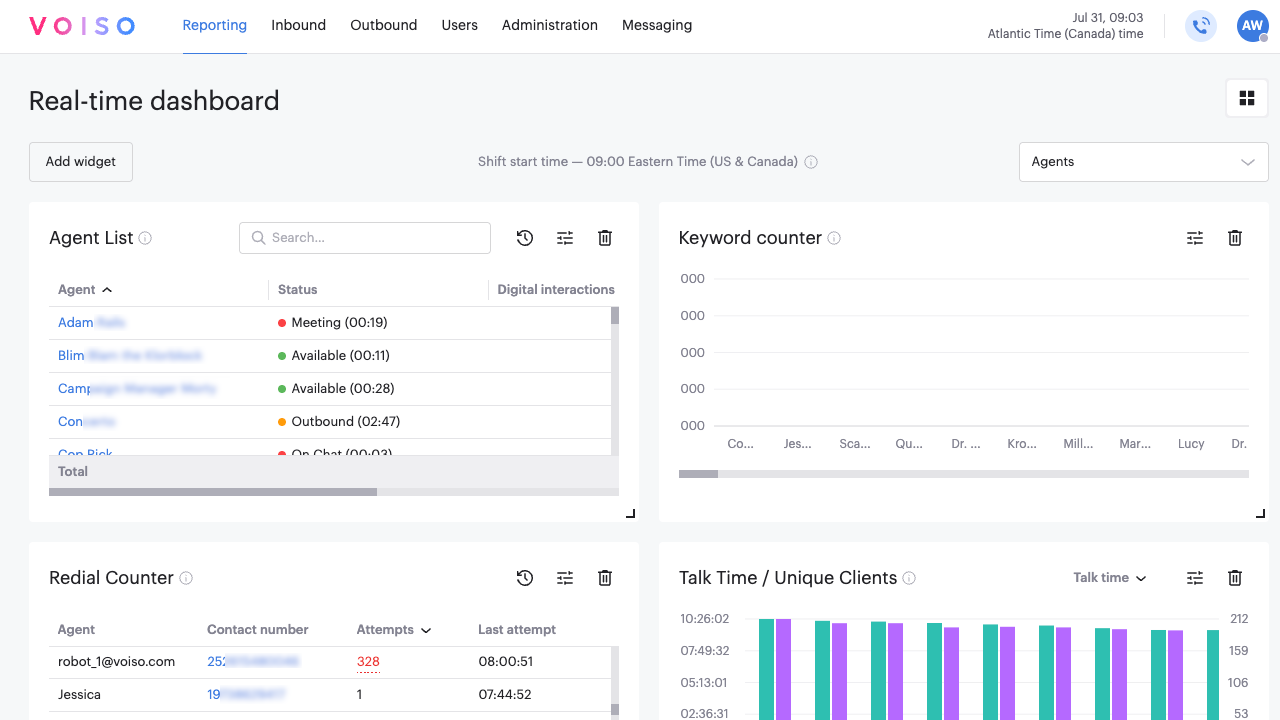
The Real-time dashboard gives contact center supervisors and administrators a centralized view of live performance metrics. Each dashboard can be customized with widgets that present up-to-the-minute data in charts and tables, tailored to your operational priorities.
You can create multiple dashboards to monitor different aspects of your contact center—such as agent availability, call queues, or outbound campaign progress. For example:
- An agent monitoring dashboard might track current status, workload, and talk time across selected users.
- A queue performance dashboard can help you monitor wait times, service levels, and abandonment rates in real time.
- Dashboards can also be created for individual teams, campaigns, or regional offices to improve visibility and accountability.
By organizing key metrics in a single view, the Real-time dashboard helps your contact center respond quickly to fluctuations in demand, identify potential issues early, and maintain consistent service quality.
Widgets by group
Real-time dashboard widgets are organized into functional groups based on what they track. You can mix and match widgets on a single dashboard, or create multiple dashboards focused on specific operational areas.
The following widget groups are available:
Agent Monitoring
| Widget | Description |
|---|---|
| Agent List | Monitor agents in real-time by selected state and metrics and access Agent Zoom to view historical metrics, manage queue assignments, and initiate call monitoring features. |
| Agent Counter | Display the number of agents by status in a pie chart view, including the total number of logged-in agents. |
| Talk Time / Unique Clients | Display a comparative bar graph showing the time agents talked to unique contacts. |
| Agent Activity Duration | Display the total time that agents spent in each status. |
| Redial Counter | Show the number of call attempts to a destination number during the reporting period. |
| Service Level | Display the Time to first response, Time to reply, and Time to resolution statistics. |
| Wrap-Up Codes | Display the wrap-up codes associated with calls your team has placed. |
| Keyword Counter | Display the number of times specific keywords occurred in conversations. |
Dialer Monitoring
| Widget | Description |
|---|---|
| Campaign Status | Display metrics such as the average time it takes for an agent to answer a call and the average call length. |
| Campaign - Call Disposition | Display the number of campaign calls by the call result: answered, no answer, busy, rejected, or failed. |
| Campaign - Agent Counter | Display the number of agents who have joined the campaign and their status. |
| Campaign - Wrap-up Codes | Display the number of campaign calls by wrap-up code. |
| Campaign - Dial Attempts | Display the number of times that each campaign contact was called. |
Queue Monitoring
| Widget | Description |
|---|---|
| Queue Counter by Channel | Show the number of calls in each queue for each channel to assist with rebalancing agents. |
| In-queue Abandons | Display the percentage and ratio of inbound calls dropped after the call reached a queue. |
| Average Speed of Answer | Display the average time it takes for a call to be answered by an agent. |
| Average Call Duration by Queue | Show the average length of calls by queue. |
| Agent Counter by Queue | Show the number of agents assigned to each queue. |
| Queue Counter Waiting Trend | Monitor the trend of interactions waiting in queue across selected queues and channels during a shift. |
Calling Number Monitoring
| Widget | Description |
|---|---|
| ASR By Caller ID By Country | Show the percentage of successfully connected calls to the total number of attempted calls by country. |
Adding dashboards and widgets
To get started, go to the Voiso navigation bar and select Reporting > Real-time dashboard.
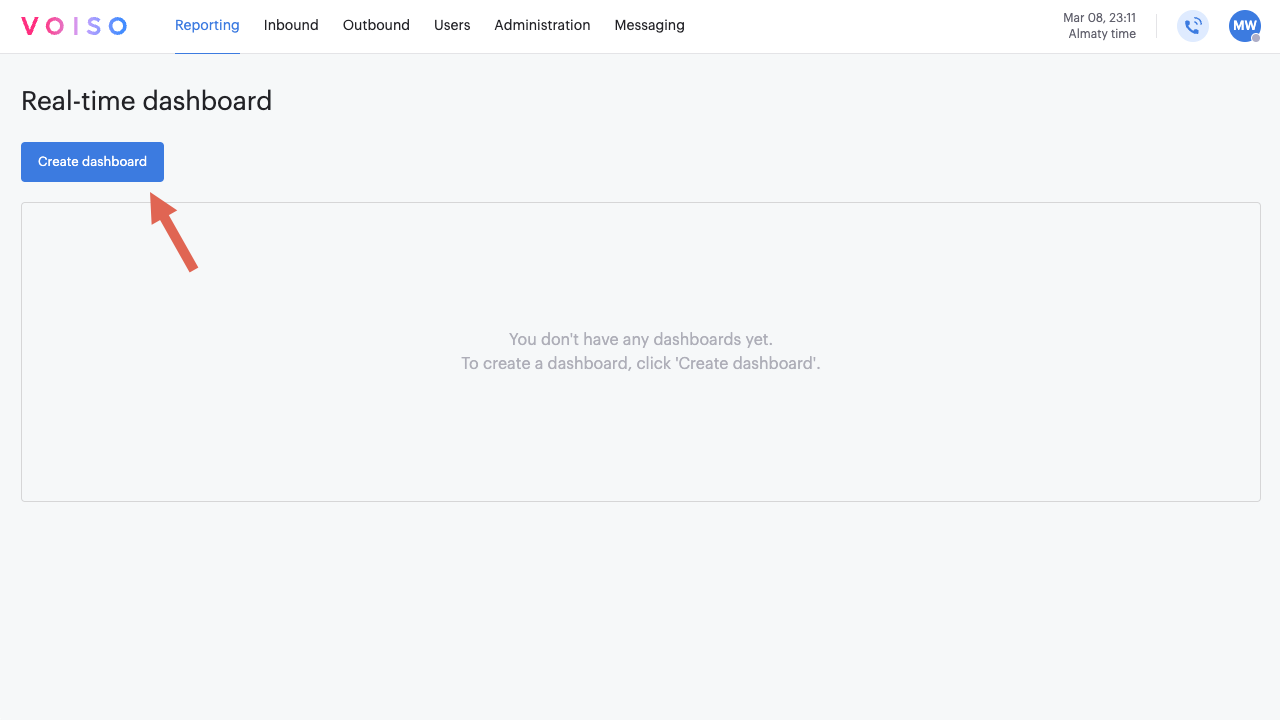
Adding dashboards
Click Add dashboard to create a new dashboard.
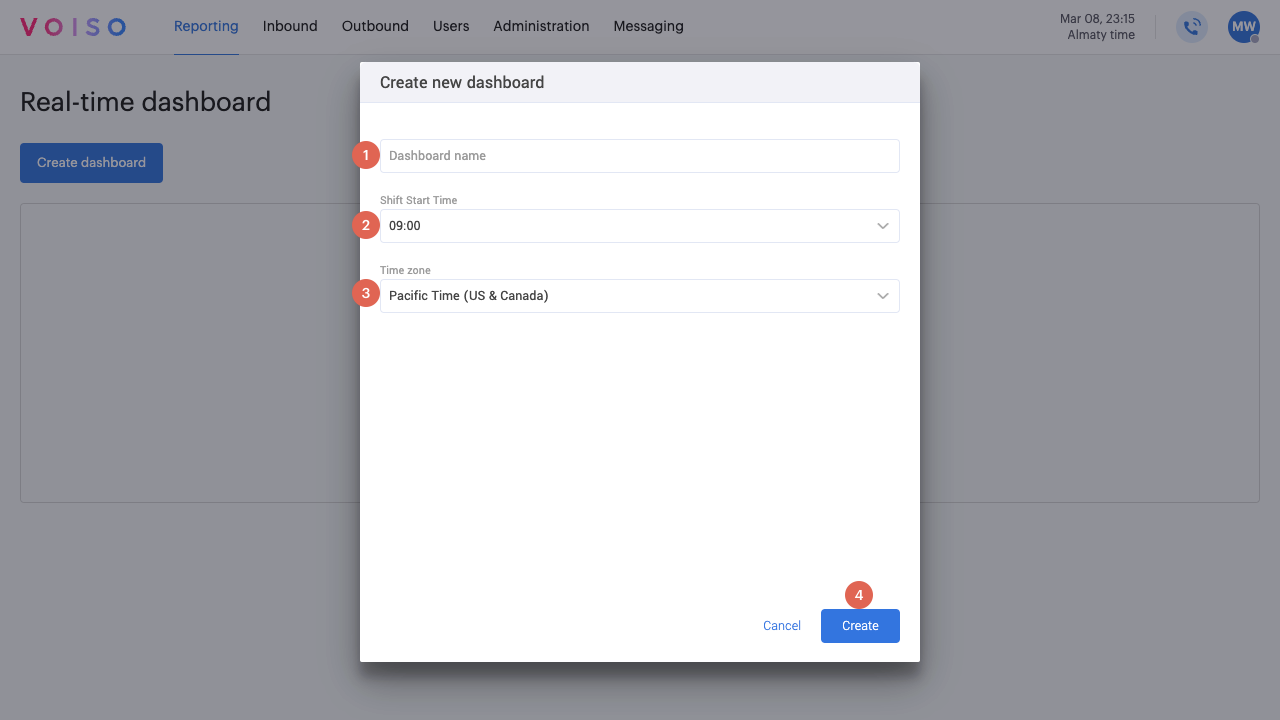
In the Add dashboard panel:
- Name the dashboard.
- Use the Shift start time menu to set the point from which statistics and metrics are calculated.
- Confirm or change the Time zone if needed. By default, this uses your contact center’s time zone, but you can select a different zone—such as where most agents or contacts are located.
- Click Create to save the dashboard.
You can create as many dashboards as you need. Use clear, descriptive names so you can easily switch between dashboards with different monitoring goals.
To switch dashboards, open the Select dashboard menu and choose another dashboard. You can also click Add dashboard from this menu to create a new one.
Adding widgets
Click Add widget to open the Add new widget panel.
Widgets are grouped by monitoring type. Use the 'i' icon next to each widget name to view a brief description. To add a widget:
- Click the icon next to the widget name to select it.
- Click Add.
- In the Edit widget panel, configure the widget parameters.
- You may optionally change the default name of your widget
- Click Save.
- To reposition a widget, simply drag it to a new location on the dashboard.
For details about each widget type and configuration, see: