Who should read this article: Administrators, Supervisors
Monitor service level statistics for omnichannel interactions.
Introduction
For Omnichannel (digital) interactions, the Service Level widget may be configured to display one or more of the following Service level statistics:
- Time to first response: % of interactions within SLA
- Time to reply: % of agent replies within SLA
- Time to resolution: % of interactions within SLA
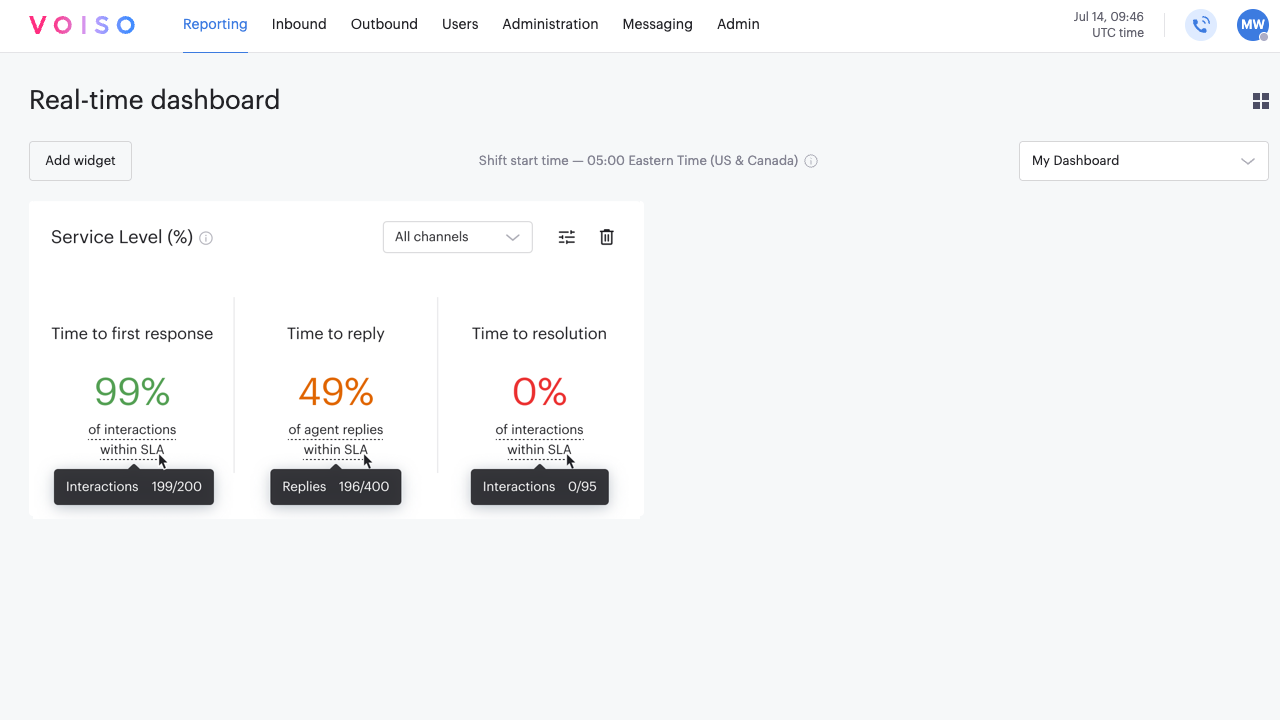
These statistics measure the level of customer service your contact center is providing to your contacts.
Color-coding
Above each statistic, the Service level displays an arc, similar to a tachometer, that is colored to indicate at a glance whether the service level is meeting expectations. The arcs are color-coded as follows:
- Green – The team is within 0% to 50% of the allotted time for the SLA metric.
- Yellow – The team is within 51% to 99% of the allotted time for the SLA metric.
- Red – The allotted time for the SLA metric has been exceeded by the team.
Service Level configuration
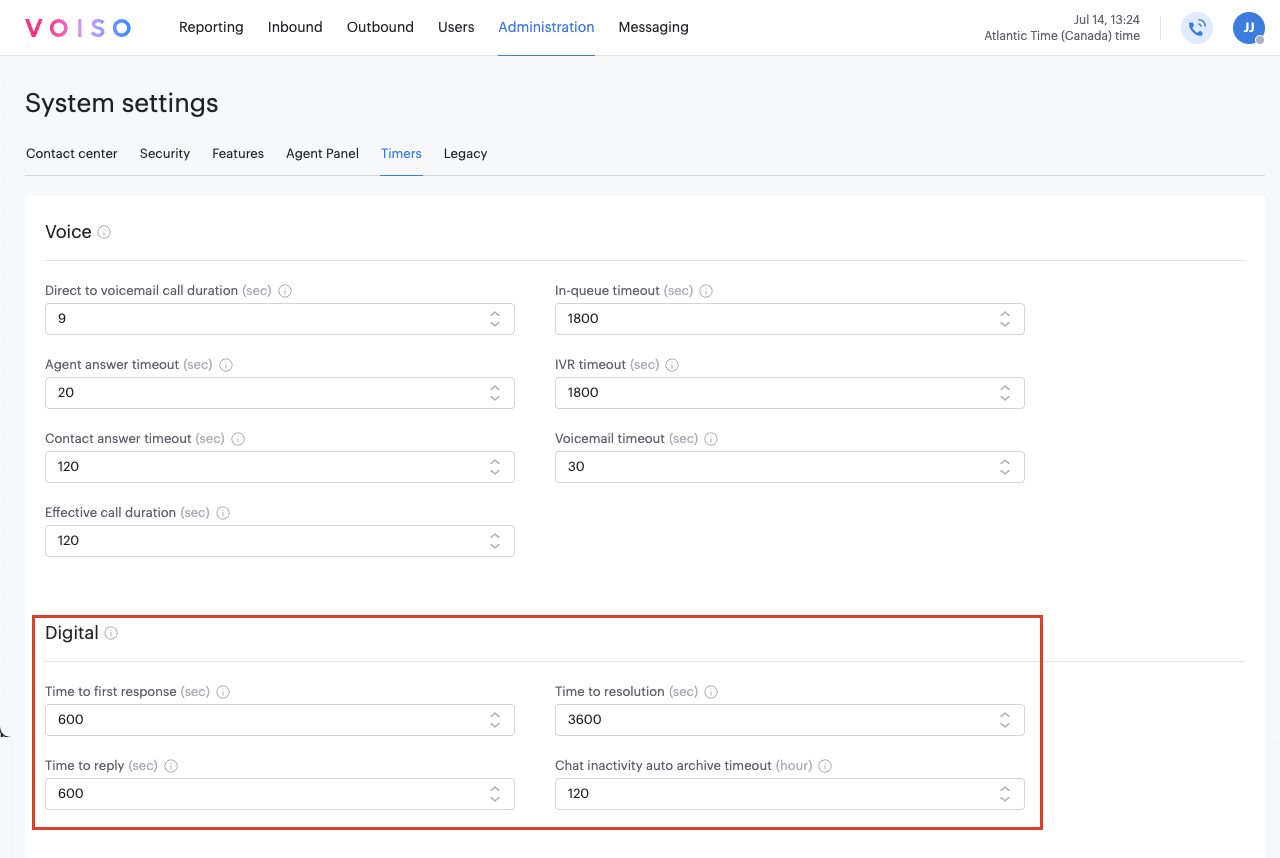
The service level metrics are configured on the Administration > System Settings page, in the Digital section of the Timers tab.
Setup
General tab
The Service Level settings panel General tab includes the following parameters:
| Statistic | Description |
|---|---|
| Time to first response | After an incoming interaction is assigned to an agent, this is the maximum time, in seconds, that an agent has to issue a first response. |
| Time to reply | In an ongoing conversation, this is the maximum time, in seconds, that an agent has to reply to the latest response from a contact. |
| Time to resolution | After an incoming interaction is assigned to an agent, this is the maximum time, in seconds, that an agent has to resolve an interaction. |
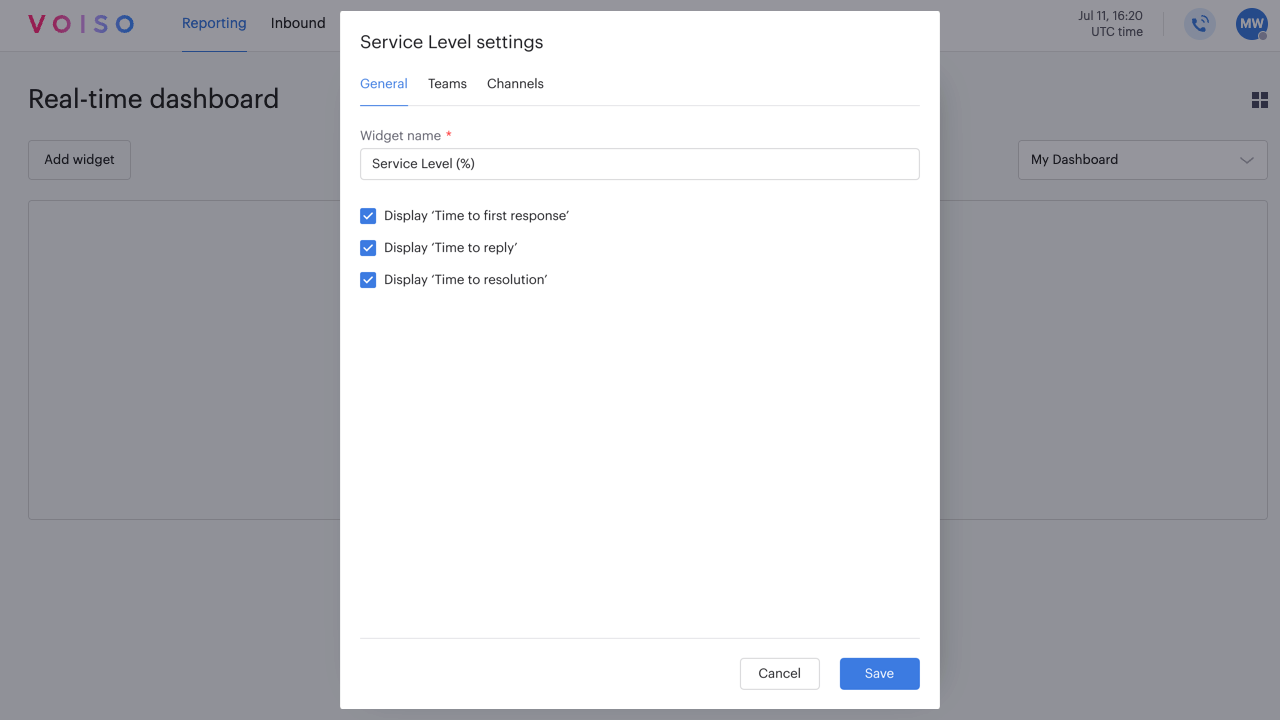
Teams tab
Select one or more teams to monitor.
Channels tab
Select one or more digital channels to monitor.